Live view (Cisco Meraki)
A design says what the WiFi should do. The controller says what it is doing right now. Live view puts both on the same plan.
What does Live view show?
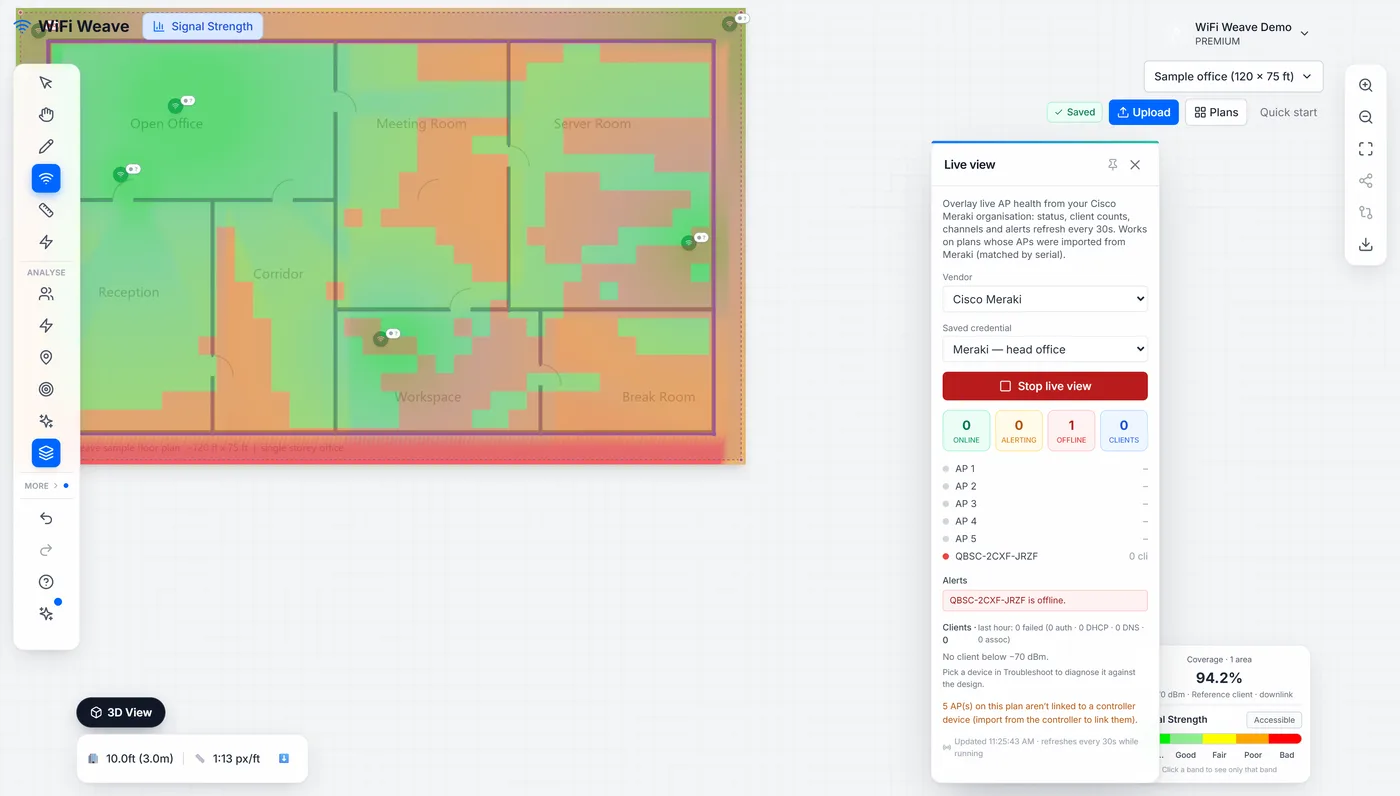
Every 30 seconds it reads each access point's status, client count and channel from the Meraki dashboard and draws them on the plan: a badge on each access point, a per-AP list, a client summary, and an alerts block that states what is wrong in a sentence.
| Alert | Raised when |
|---|---|
| AP is offline | The dashboard reports the access point disconnected |
| Channel differs from the plan | The live channel is not the one the design assigned |
| Carries more clients than the design load | Client count on one access point exceeds the per-AP load from the capacity profile |
| Failed connections stopped at AUTH, DHCP or DNS | Half or more of the last hour's failed connections stopped at one step — a network-service problem, not radio |
| Clients below −70 dBm | Three or more connected clients report a weak signal |
How do I connect a Meraki organisation?
- In the Meraki dashboard, enable API access (Organization → Settings → Dashboard API access) and generate an API key for your profile.
- In WiFi Weave, open the Access Points panel, Import tab, choose Cisco Meraki, paste the key, Test it, List networks, pick the network and Save the key under a label. See imports.
- Click Import → current plan so the access points on the plan are linked to the dashboard devices by serial.
- Open Live view from More tools, pick the saved credential and click Start live view.
Where the key lives
Saved keys are stored encrypted on the server and never shown again; the panel offers them by label. Delete a saved key from the same panel. A read-only API key is enough for Live view and Troubleshoot.
Can I compare the design with what is deployed, or push the plan to Meraki?
Both, from the Meraki section of the Import tab. Designed vs deployed compliance runs one requirement profile against the plan's design and against the live network on the same floor, and reports the two pass percentages and the difference, so a client can see what the refresh buys. Push plan to Cisco Meraki writes this plan's channels and transmit power to the access points you imported, matched by serial; Preview lists every change first and nothing is written until you click Apply.
How are access points matched to the controller?
By serial number, which the Meraki import stores on each access point. Access points placed by hand or imported from a file have no serial, so Live view lists them as not linked; import them from the organisation and they arrive linked. Names and models do not have to match.
Which controllers are supported?
Cisco Meraki. It is the one controller WiFi Weave offers live because it is the one proven end to end against a real organisation: import, live status, alerts and troubleshooting. Other controllers are added as each is proven the same way, not before; in the meantime any controller's inventory can be brought onto the plan as a JSON export, without live data.
Common questions
Which plan includes Live view?
Live view and the Meraki connector are on the Pro and MSP plans, and in the 7-day Pro trial.
Does Live view change anything on the controller?
No. Live view and Troubleshoot only read. Writing the plan's channels and power to the dashboard is a separate, explicit action, Push plan to Cisco Meraki on the Import tab, which previews every change before you apply it.
Why does the live data disappear when I close the panel?
The live snapshot is held only while the panel is open, so nothing stale is left on the plan. Pin the panel (the pin icon in its header) to keep it open while Troubleshoot opens beside it.